
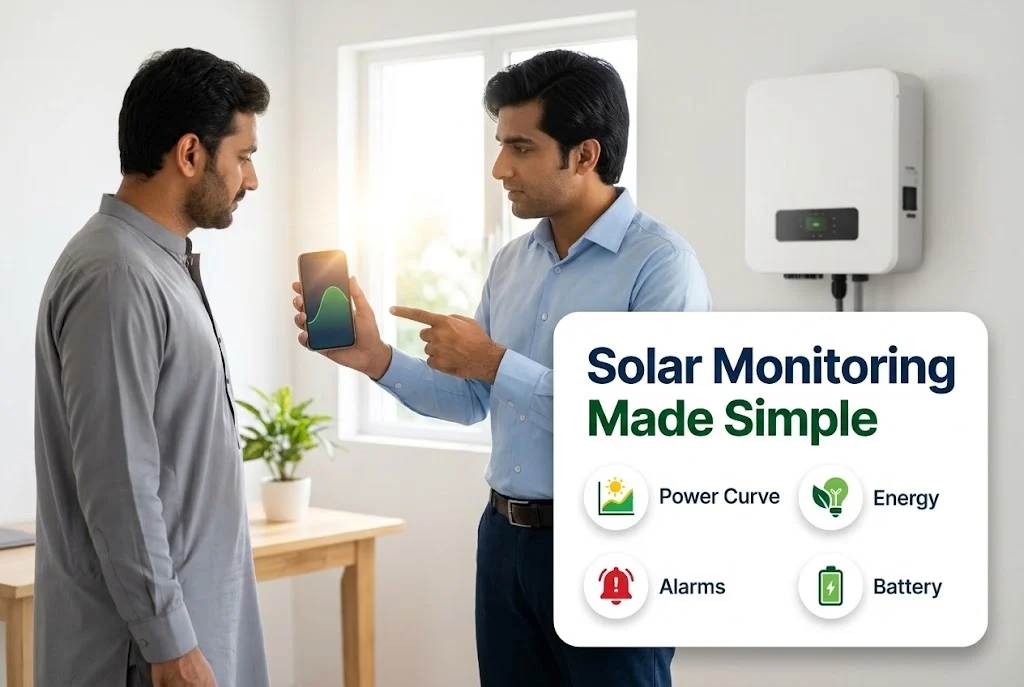
Most modern inverters report to an app or a web portal. It is the quickest way to see how your system is doing, and when you contact support it is the first thing we ask to see.
This guide explains what we look at and how you can help us help you.
Key takeaways
- Daily and monthly energy show the trend; power curves show the day.
- A clean bell-shaped curve on a clear day is a healthy sign.
- Dips, flat tops and sudden drops point to shade, limiting or faults.
- Screenshots and notes speed up support.
What the portal shows
- Power now and the curve of power through the day.
- Energy for the day, month and total.
- Alarms and events with times.
- The state of the battery, where one is fitted.
- Per-string or per-panel data, on systems that provide it.
Reading the curve
On a clear day the power should rise smoothly in the morning, peak around midday and fall in the afternoon. A deep notch may mean shade from a tree or a structure at that time. A flat top may mean the inverter is limiting the power, which can be normal for a small inverter or the result of a setting. A sudden drop to zero in the day points to a fault or a utility cut.
What to send us
- A screenshot of the power curve of the problem day and of a good day.
- A screenshot of the alarm or event list.
- The make and model of the inverter.
- What you noticed and when it began.
What we do with it
We compare the days, check the alarms and decide whether the cause is likely to be shade, dust, a settings issue, a utility problem or a fault, and then advise or arrange a visit. See how a technician diagnoses a fault for what happens on site.
When to call us
Send us screenshots of your monitoring and a few lines about what you see and we will look at it. Use the contact page, see our technical support, or look at the inverters we supply.
Leave a comment