
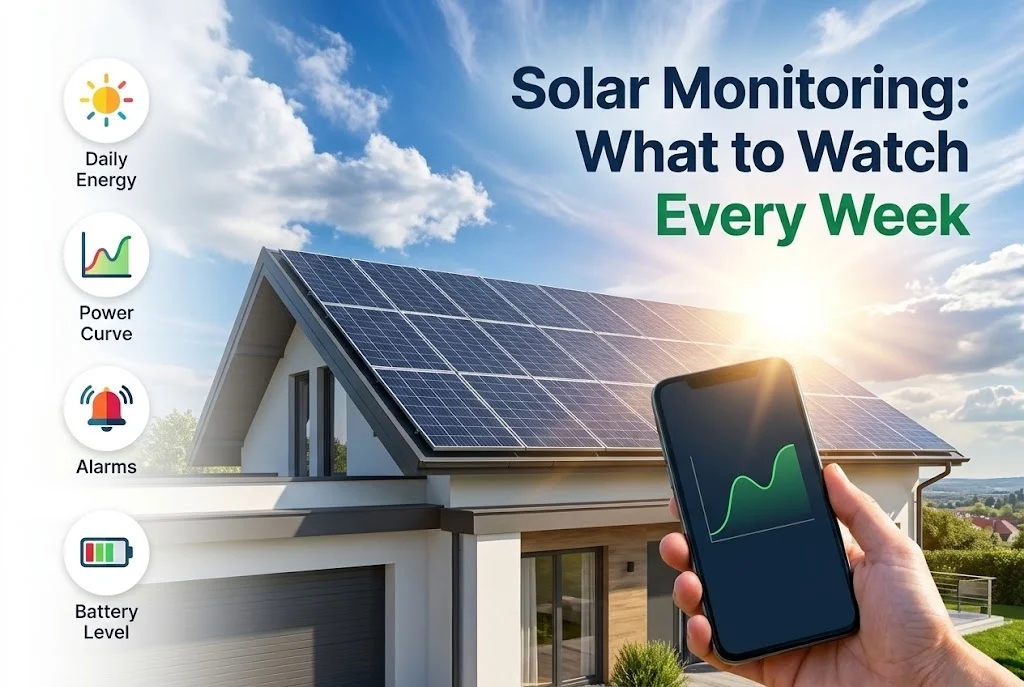
Most solar inverters send data to an app or a web page. Many owners install it and never open it again. A short look once a week costs five minutes and can reveal a problem long before the bill does.
Key takeaways
- A healthy day shows a smooth, bell-shaped production curve; dips, flat tops and gaps need attention.
- Compare like with like: clear days with clear days, and the same season.
- Check each string or MPPT, if shown, and any alerts or error history.
- Keep a simple record so that a slow decline is visible.
1. The daily curve
On a clear day, power rises from sunrise, peaks around midday and falls to sunset in a smooth curve. Sharp dips can mean passing cloud or a nearby shadow. A flat top at a level below the system rating may mean the inverter is limiting its output, because of heat or the export limit. Gaps mean the inverter stopped. See why your solar system is producing less power.
2. Daily, monthly and yearly totals
Look at the energy (kWh) for the last week and month, and compare it with the same period earlier, bearing the weather in mind. A drop on clear days, with no change in the weather, is the sign to investigate. Remember that winter output is normally lower than in spring.
3. String and MPPT values
If the app shows the voltage and current of each input, compare them. Two strings of the same layout should give similar values. One that is consistently lower may have shade, dirt or a damaged panel. See solar string design basics.
4. Alerts and history
Open the event or alarm list. Occasional grid faults are normal; repeated insulation faults, over-temperature or communication losses are not. Set the app to send you notifications for faults if it can.
5. For hybrid systems
Check the battery state of charge, the charge and discharge power, the grid import and export, and whether the system is behaving as set, for example charging from solar first. A battery that no longer reaches full charge, or drops quickly, may be ageing. See when to replace a UPS or solar battery.
6. A simple weekly routine
- Open the app on a clear day around midday and look at the live power.
- Check last week's daily production for dips.
- Look at alerts and the status of each input.
- Write the weekly total in a notebook or a spreadsheet.
- If something looks wrong, take screenshots and call us.
Next step
If your system has no monitoring, or you cannot read it, we can help set it up; ask through the contact page.


Leave a comment